Finance Guru Speaks: Recently I have come across a YouTube video of a very famous TV Personality. He has shared details about an Indicator to find out Market Top.
As per Video, Market Top can be found out by Nifty/Gold Ratio Indicator (Nifty vs Gold) on the Charts.
- If Nifty/Gold Ratio value is near 0.40, It indicates Market Top & chances are high that it will fall.
- If Nifty/Gold Ratio value crosses above 0.25 from below, it indicates the Market can reverse from downtrends & chances are high that it will become bullish again.
You can search this video on YouTube to find out more details.
One common question I came across in the Video Comments Section is "Please tell me how to plot this Nifty/Gold Ratio on the Charts?"
I am writing this article to answer this question.
I have provided my comment (many times) in the Video Comment section, but somehow my comment was getting deleted again and again automatically.
Sharing Steps to draw NIFTY/GOLD Indicator on Charts:-
1. Open Tradingview India website and put Nifty 50 chart (use Line Chart instead of Candlestick). As per the Video, select Weekly Chart duration.
2. Click Compare button on the top row. Search keyword GOLD2! and select it.
 |
| Click to enlarge - How To Plot Nifty vs Gold Ratio On Charts |
3. Now, you have both Nifty & Gold Chart lines in front of you in a single Chart.
The Next Step is to draw Nifty vs Gold Ratio Line.
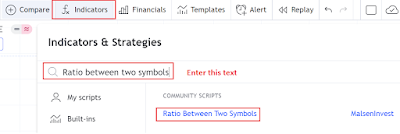
4. Click Indicators button on the top row. Search for Ratio between two symbols keyword and select this indicator.
 |
| Click to enlarge - How To Plot Nifty vs Gold Ratio On Charts |
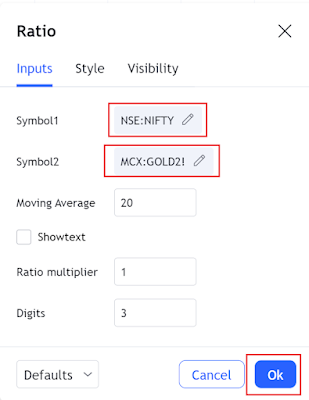
5. Go to Settings of this indicator.
 |
| Click to enlarge - How To Plot Nifty vs Gold Ratio On Charts |
6. Put Symbol1 = Nifty 50 and Symbol2 = GOLD2! and click Ok.
 |
| Click to enlarge - How To Plot Nifty vs Gold Ratio On Charts |
Now you can see a Nifty/Gold Ratio Line as explained in this Video. Hope it helps.
 |
| Click to enlarge - How To Plot Nifty vs Gold Ratio On Charts |
If you like my work, then you can support me by subscribing to my YouTube Channel - FINANCE guru SPEAKS and sharing this article over your Social Networks. ✌
Images Courtesy: Tradingview Website

No comments:
Post a Comment
Thanks for your interest. Keep visiting.
Sincerely,
Finance guru Speaks